By George Karayannis, LEED AP
![]() We continue our series on the new ISO 37120 smart city standard with a look at the 15th of 17 themes defined in the standard -- urban planning indicators. As previously described, ISO 37120 includes 46 ‘Core’ (must report) and 54 ‘Supporting’ (should report) indicators. The urban planning theme has one Core and three Supporting indicators.
We continue our series on the new ISO 37120 smart city standard with a look at the 15th of 17 themes defined in the standard -- urban planning indicators. As previously described, ISO 37120 includes 46 ‘Core’ (must report) and 54 ‘Supporting’ (should report) indicators. The urban planning theme has one Core and three Supporting indicators.
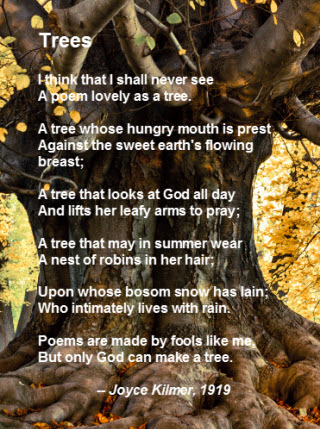 I clearly remember this poem from middle school, but doubt if I ever really knew more than the first verse. Poet Joyce Kilmer wrote this poem in 1919 -- apparently in awe of the natural power and beauty of trees. As billions of people ultimately consolidate into increasingly dense urban environments over the next century, they may share Kilmer's awe for trees and urban green space.
The smart city standard's urban planning indicator has cities reporting on green space and trees planted per capita, the areal size of informal settlements, and the jobs/housing ratio.
In addition to inspiring classic poetry and giving children something fun to climb on, trees and forests, or "green infrastructure,” provide fairly obvious health benefits and very compelling economic benefits. According to a U.S. Department of Agriculture report, urban forests in the U.S. contain about 3.8 billion trees with a 'structural asset value' of $2.4 trillion. Or perhaps to paraphrase Kilmer, "I think that I shall never see a structural asset as valuable as a tree!"
Urban forests provide multiple benefits
Urban forests improve air and water quality, reduce energy use and help mitigate greenhouse gas (GHG) emissions. The impact of 100 million trees planted around U.S. residences is estimated at $2 billion per year in reduced energy costs due to lower heating and cooling needs. Urban trees are also estimated to remove some 748,000 tons of air pollution worth about $3.8 billion annually, and store 770 million tons of carbon worth $14.3 billion. In addition to these compelling benefits, trees can also help increase property value and sales tax. A study in Seattle, for example, showed that prices for goods were 11% higher on average in landscaped areas than in areas with no trees. Of course, wealthier neighborhoods can generally afford more trees.
City trees also reduce storm water runoff, saving money on water treatment costs. For example, during an intense storm in Dayton, Ohio, the city’s trees were estimated to have reduced water runoff 7%.
Sacramento, California claims more trees per capita than any other city in the world and has embarked on a 40-year plan to double the city's tree canopy. According to a study by NASA, trees can lower urban ground temperatures in cities like Sacramento up to 36 degrees on a hot day. “We always meet people in Sacramento that still do not have air conditioning on 110-degree days because they live beneath the canopy of the trees,” said Sacramento Councilman Ray Trethaway during an interview with NPR.
![]()
Core Indicators
1. Green area (hectares) per 100,000 population
Green area is broader than recreational space (defined in indicator #9 – recreation) which only reflects green space that is ‘publicly accessible.’ With the urban planning indicator, it does not matter if green space is protected. The World Health Organization (WHO) has suggested that every city should have a minimum of 9 m2 of green space per person. An optimal amount would sit between 10 and 15 m2 per person. One of the greenest cities in the world is Curitiba in Brazil, with 52 m2 per person, followed by Rotterdam, New York City and Madrid. A Siemens Green City Index report calls New York and Singapore role models for spatial planning, as both have been able to combine extensive green spaces with high population density. At the lower end, Tokyo has just 3 m2 and Buenos Aires 1.9 m2 of preen space per person.
Supporting Indicators
1. Annual number of trees planted per 100,000 population
This indicator provides a useful measure of a city’s commitment to urban and environmental sustainability, as well as municipal beautification. Here's an example: Earlier this month the city of Chicago completed its 2014 tree planting that included 6,652 trees citywide as part of Mayor Rahm Emanuel’s “Building A New Chicago” infrastructure investment program. Next year's goal is to plant 7,800 trees. “Chicago was one of the first cities where planting trees and urban forests were part of the city’s plan and design,” the mayor said. “By planting thousands of trees each year, we are helping to maintain the urban canopy’s vibrancy for generations to come.” And Chicago is not alone, of course. In Visakhapatnam, India – hard hit last month by the Hudhud cyclone -- Chief Minister N Chandrababu Naid vowed to rebuild the city into a beautiful, resilient destination. An aggressive tree planting program is part of that. One day earlier this month, 79,000 saplings were planted in 72 wards around Visakhapatnam.
2. Areal size of informal settlements as a percent of city area
Informal settlements – which go by various names around the world, from favelas in Brazil to squatter camps in South Africa -- typically refer to housing units that are either illegally occupied or have been constructed on property that the squatters have no legal claim to. These settlements often pose problems for cities due to sanitation and health concerns, among others. The African Green City Index, for example, reveals a clear connection between the percentage of people living in informal settlements and a city’s overall performance. A high share of people living in such settlements correlates with a lack of drinking water, electricity and waste management and sewage systems.
3. Jobs / housing ratio
As waves of people move to cities, attracting new businesses will help provide more jobs and economic growth. But will the jobs be where the people live so that getting to and from work doesn't require lengthy commutes? Will new housing be built in areas where infrastructure and services already exist? And what is the right mix of jobs to housing? The American Planning Association in 2003 published a planning tool for local governments that tackled that issue. The often cited Jobs-Housing Balance report suggested acceptable ranges of jobs-to-housing ratios are between 1.3:1 to 1.7:1. But going beyond numbers, other factors must enter the discussion, including whether the jobs match a community's labor force skills and whether there is housing that meets the needs and price range of the workers who want to live in the area. A 2013 study of Beijing's jobs-housing ratio explained the challenge this way: "An area is considered jobs-housing balanced when resident workers have access to a job within reasonable travel distance and time, or when the available housing and job types complement each other." Cities are increasingly seeing the advantages of mixed-use development that clusters housing, transit centers and basic services.
###
George Karayannis has over 25 years of emerging technology and complex solutions sales, business development and marketing experience. He is currently Director Utility Sales, Trimble Energy and has held leadership positions at Schneider Electric, Lockheed Martin Energy Solutions, AT&T and wireless sensor startups. He has also served as a city councilman and is restoring a 100-year old opera house to LEED Gold status. @gkarayannis
Next in the series –Wastewater indicators for smart cities
Previously in our Dissecting ISO 37120 series:
- Why this new smart city standard is good news for cities
- Economic indicators in the new smart city standard
- Why education may be the most important smart city indicator of all
- What the new smart city standard says about energy
- Does your city's air quality measure up to the new smart city standard?
- How debt, spending and tax collections add up in new smart city standard
- Fire and emergency response indicators -- how safe is your city?
- How voting, women and corruption figure in the smart city standard
- How healthy is your city (and what zip codes have to do with it)
- How fun is YOUR city? (And yes, it really does matter)
- How safe is your city? (Hint: run the numbers on homicides and response times)
- Gimme shelter, please! The homeless challenge cities face
- The long road to zero waste cities
- How connected (and innovative) is your city?
- The long road to zero waste cities
- How smart is your city about transportation?