By George Karayannis, LEED AP
![]() We continue our series on the new ISO 37120 Smart City standard with a look at the 14th of 17 themes defined in the standard – transportation indicators. As previously described, ISO 37120 includes 46 ‘Core’ (must report) and 54 ‘Supporting’ (should report) indicators. The transportation theme has four Core and five Supporting indicators.
We continue our series on the new ISO 37120 Smart City standard with a look at the 14th of 17 themes defined in the standard – transportation indicators. As previously described, ISO 37120 includes 46 ‘Core’ (must report) and 54 ‘Supporting’ (should report) indicators. The transportation theme has four Core and five Supporting indicators.
![]() Private car service startups Uber and Lyft are growing rapidly, generating headlines and raising capital at eye-popping valuations because their services are disruptively convenient, reduce drunk driving and help overcome racial bias. However, these high-profile companies do little to reduce a city’s greenhouse gas (GHG) emissions or ease daily traffic congestion. Every day about 3 billion people travel to and from work, consuming vast amounts of natural resources and generating significant GHG emissions in the process. While many workers travel on foot, bike or public transportation, in the U.S. all too often we travel by single occupant vehicles (SOVs), which generate almost a pound of CO2 per mile traveled. SOVs generate over four times the carbon footprint of the subway or a van pool, three times the carbon footprint of light rail, and one and a half times the carbon footprint of bus transit. In fact, cars, SUVs, and trucks account for over 17% of all U.S. emissions, with transportation the second largest source of total U.S. GHG emissions behind power generation.
Private car service startups Uber and Lyft are growing rapidly, generating headlines and raising capital at eye-popping valuations because their services are disruptively convenient, reduce drunk driving and help overcome racial bias. However, these high-profile companies do little to reduce a city’s greenhouse gas (GHG) emissions or ease daily traffic congestion. Every day about 3 billion people travel to and from work, consuming vast amounts of natural resources and generating significant GHG emissions in the process. While many workers travel on foot, bike or public transportation, in the U.S. all too often we travel by single occupant vehicles (SOVs), which generate almost a pound of CO2 per mile traveled. SOVs generate over four times the carbon footprint of the subway or a van pool, three times the carbon footprint of light rail, and one and a half times the carbon footprint of bus transit. In fact, cars, SUVs, and trucks account for over 17% of all U.S. emissions, with transportation the second largest source of total U.S. GHG emissions behind power generation.
![]()
Mass transportation systems can be critical enablers of sustainable city growth, especially in developing countries where mega-cities are currently being built or planned. City leaders are increasingly interested in leveraging their mass transportation infrastructure to spur transit-oriented development, mixed-used communities integrated into a walkable neighborhood and located within a half-mile of quality public transportation. However, mass transit requires significant financial capital and even greater political capital. For example, California’s planned 800 mile, high-speed rail link between Los Angeles and San Francisco is expected to cost nearly $70 billion – or about $90 million per mile. California Gov. Jerry Brown first proposed high-speed rail in 1982 during his first term, and after 30+ years the project continues at a snail’s pace, its future constantly in doubt.
4 key elements of mass transit
City leaders seeking to implement mass transit systems should focus on four key elements:
- Building institutional capacity at the city level
- Promoting integrated citywide public transport networks
- Creating sustainable business models
- Ensuring system affordability and safety for all
This ISO 37120 indicator has cities reporting on the extent of their mass transit and non-car infrastructure, overall transportation safety and direct flight inter-connectedness. Large mass transit systems typically cross city boundaries, which may complicate the measurement of this data.
![]()
Core indicators
1. Kilometers of high capacity public transportation per 100,000 population
This indicator includes heavy rail metro, subway and commuter rail systems, but excludes bus rapid transit (BRT). Metro systems have been popular since the London Underground opened in 1863, and are growing rapidly in China (2,500 km under construction) and India (600 km) in particular. Worldwide there are 187 cities with metro systems serving an average of 111.5 million passengers daily. Following are the largest subway systems in the world and my calculation of their ISO 37120 metric for this indicator:
![]()
2. Kilometers of light passenger public transportation systems per 100,000 population
This indicator includes light rail streetcars, trams, buses and other light passenger transport services, including BRT. While I could offer many anecdotal stories extolling or comparing various public transportation systems globally, I could not find any information as defined by this indicator -- once again underscoring the need for ISO 37120’s consistent measurement and reporting of key city performance indicators.
3. Annual number of public transport trips per capita
In terms of public transportation at the country level, there is Switzerland, and then everyone else. The Swiss average about 237 trips per capita, 70% more than Sweden and Germany, both tied for second (139), and fully 10 times the U.S. (24). Canada (55) has more than twice the level of public transport than the U.S., likely due to denser populations, higher fuel costs and early public support for public transportation. The Netherlands (51) may seem low on the surface, but that is only because of the country's wholesale embrace of bicycles, which accounted for 26% of all trips for the Dutch in 2008. In the U.S., New York City (229) is the clear leader, followed by San Francisco-Oakland (131) and the Washington, D.C. metro area (100).
4. Number of personal automobiles per capita
Once again, differences in definitions of this metric globally make comparisons difficult, as many countries count SUVs as trucks and not personal automobiles. With SUVs and trucks included, the U.S. (0.82) leads the world in automobiles per capita, excluding the micro-nations of Monaco (0.85) and Liechtenstein (0.83), according to data from the World Bank.
Supporting Indicators
1. Percentage of commuters using travel mode to work other than a personal vehicle
While U.S. public transportation systems have seen steady growth recently due to economic weakness and generational preferences, only 5% of Americans on average take public transportation to work, while 86% of Americans still commute to work via a personal automobile -- and most of them as the sole occupant. Of course this number is much higher in cities – 31% in NY/NJ and 15% in the D.C. metro area. Internationally, 25% of respondents reported using public transportation daily as reported in a 17-country National Geographic Society 2009 survey.
2. Number of two-wheel motorized vehicles per capita
Note that this indicator includes motorcycles and scooters or mopeds, but excludes bicycles. Scooters and low-powered motorcycles are especially popular in southern Europe and throughout Asia. Greece leads the pack in term of ‘powered two wheelers,’ with 150 mopeds and 100 motorcycles per 1,000 inhabitants, a per capita rate of 0.25. And while the Italians may like their cars (7th in terms of automobiles per capita), they absolutely love their motorcycles. Italy has 8.6 million motorcycles on the road, a per capita rate of 0.143, not including scooters. In the U.S., South Dakota is the most motorcycle-loving state (0.083) followed by New Hampshire (0.060).
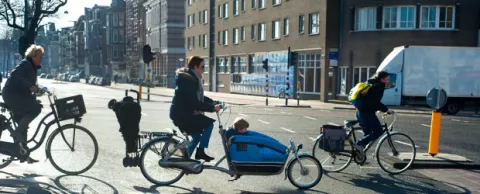
3. Kilometers of bicycle paths and lanes per 100,000 population
There is much anecdotal evidence about how ‘bicycle friendly’ various cities are, but very little information reported consistently in line with this indicator – especially since most bikeways span multiple municipalities or even regions. Amsterdam, the most bicycle-friendly city in the world has 400km of dedicated bike paths, or 0.51 km per 100,000 people. In the U.S., Minneapolis, second only to Portland in the number of bicycle commuters, reports having 120 miles (193 km) of bikeways or 0.48 km per 100,000 people.
4. Transportation fatalities per 1000,000 population
For too many people around the world, the safety promise of autonomous vehicles can’t arrive soon enough. According to the World Health Organization (WHO), traffic accidents kill more people globally than malaria, and are the leading cause of death for young people, claiming nearly 3,500 lives every day and almost 1.3 million per year. Car crashes are also very expensive – costing more than $500 billion each year. The world average is 18 deaths per 100,000 people. Eritrea (48.4) has the highest traffic death rate per 100,000 population, followed by Libya (34.7), South Africa (33.2) and Iran (32.2). The U.S. fatality rate is 10.7 deaths per 100,000 people. Massachusetts (4.8) is the safest state in terms of traffic fatalities, with Wyoming (27.5) and Mississippi (21.6) the most dangerous states.
5. Commercial air connectivity (number of non-stop commercial air destinations
This is an interesting indicator to include, as non-stop flights are generally determined based on airline business considerations, as well as regulatory restrictions or gate limitations at airports. For this metric, ISO 37120 includes all airports within a "two hour travel distance from the subject city." However, the standard is currently silent as to whether this includes all forms of transportation to the airport. For example, a two hour travel time via high-speed rail will include far more cities than more typical forms of road transportation.
###
George Karayannis has over 25 years of emerging technology and complex solutions sales, business development and marketing experience. He is currently Director Utility Sales, Trimble Energy and has held leadership positions at Schneider Electric, Lockheed Martin Energy Solutions, AT&T and wireless sensor startups. He has also served as a city councilman and is restoring a 100-year old opera house to LEED Gold status. @gkarayannis
Next in the series: Urban planning indicators for smart cities
Previously in our Dissecting ISO 37120 series:
- Why this new smart city standard is good news for cities
- Economic indicators in the new smart city standard
- Why education may be the most important smart city indicator of all
- What the new smart city standard says about energy
- Does your city's air quality measure up to the new smart city standard?
- How debt, spending and tax collections add up in new smart city standard
- Fire and emergency response indicators -- how safe is your city?
- How voting, women and corruption figure in the smart city standard
- How healthy is your city (and what zip codes have to do with it)
- How fun is YOUR city? (And yes, it really does matter)
- How safe is your city? (Hint: run the numbers on homicides and response times)
- Gimme shelter, please! The homeless challenge cities face
- The long road to zero waste cities
- How connected (and innovative) is your city?