By George Karayannis, LEED AP
We continue our series on the new ISO 37120 Smart City standard with a look at the 10th of 17 themes defined in the standard -- safety indicators. As previously described, ISO 37120 includes 46 ‘Core’ (must report) and 54 ‘Supporting’ (should report) indicators. The safety theme has two Core and three Supporting indicators.
This theme primarily measures the level of crime in a city, which is one of the most important indicators of livability as residents and businesses generally want to ![]() avoid high-crime areas. Crimes against people and property drive away citizens, drive up insurance and policing costs, and can seriously erode a city’s hard-earned brand. Chicago, widely recognized as the “Windy City,” is now commonly referred to by some as “Chiraq,” a mashup of Chicago and Iraq that reflects the city’s high crime rate and deadly violence. Despite Chicago’s dubious distinction, crime in the city has fallen consistently since 2001, with summer spikes recurring like clockwork. In fact, crime in developed countries has fallen consistently since 1950, according to the Economist. In the U.S., violent crime has fallen 32% since 1990, with a 64% drop in the biggest cities.
avoid high-crime areas. Crimes against people and property drive away citizens, drive up insurance and policing costs, and can seriously erode a city’s hard-earned brand. Chicago, widely recognized as the “Windy City,” is now commonly referred to by some as “Chiraq,” a mashup of Chicago and Iraq that reflects the city’s high crime rate and deadly violence. Despite Chicago’s dubious distinction, crime in the city has fallen consistently since 2001, with summer spikes recurring like clockwork. In fact, crime in developed countries has fallen consistently since 1950, according to the Economist. In the U.S., violent crime has fallen 32% since 1990, with a 64% drop in the biggest cities.
"Ensuring public safety is a critical function of city leadership, and key to improving public safety and security is accurately measuring and reporting on key metrics," said Riadh Tappuni, Director, Development and Design International, Toronto. "The new ISO 37120 smart city standard will help police departments and city leaders better understand, more easily benchmark and ultimately improve public safety in their cities."
Improving social conditions helps
A visible and engaged police presence is a critical element in deterring crime, as reflected by the ISO 37120 indicators measuring police officers per 100,000 population and response time. However, many cities are finding that it takes more than law enforcement and criminal justice to combat crime. Community involvement, economic opportunities, substance abuse treatment and socially inclusive programs for at-risk individuals such as midnight basketball, for example, have been shown to reduce crime in targeted areas. Keeping people from committing their first criminal act is especially important, given that half of all crime is committed by those who have already been through the criminal justice system. “Improving social conditions and integrating people socially can probably combat crime much more effectively than building new prisons,” wrote Dirk Helbing, a professor of sociology and researcher at ETH Zurich, in ‘The Reasons Behind Crime.’
Crime fighting has also gone seriously high-tech, as demonstrated by Council Lead Partner IBM working with the city of Memphis on an analytics-based approach that successfully predicted where and when crime was likely to occur. Despite having overtones of the 2002 movie Minority Report, since 2006 the highly successful program has cut serious crime 30%, violent crime 15%, and led to a dramatic increase in the number of felony cases solved.
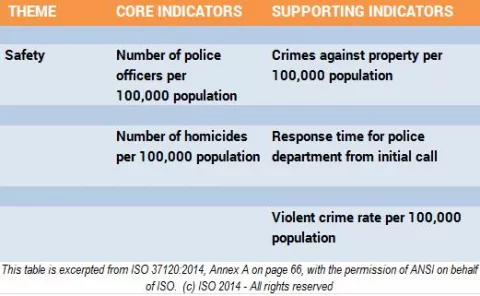
Below we'll look at the safety indicators the new smart city standard highlights.
![]()
Core Indicators
1. Number of police officers per 100,000 population.
A city with a larger proportion of police officers is somewhat more likely to have a lower crime rate, as detailed by analysis from the Civitas Institute for the Study of Civil Society. It follows, then, that cutting police departments in times of budget crisis can lead to increased crime rates. In 2010, England announced a cut of 20% in police funding as part of the country’s austerity measures, raising concerns about a potential increase in crime. While response times have slowed and officer workloads have increased, crime rates still appear to be falling throughout England.
This indicator includes sworn law enforcement officers with full arrest powers, either working full or part time. Civilians and support staff are not counted. The most heavily policed country per capita is Russia, with 564.6 police offers per 100,000 population, followed by Turkey (474.8) and Italy (467.2). In the U.S., the city with the highest police officer ratio is Washington, D.C. (612), followed by Baltimore (474), and Chicago (441), with the fewest police officers per capita in Colerain Township, Ohio (67) and Waterford Township, Michigan (69), according to the Justice Bureau of Justice Statistics.
2. Number of homicides per 100,000 population.
![]() Despite varying definitions, ‘homicide’ is perhaps the most widely collected and reported crime in law enforcement and criminal justice statistics. Due to its seriousness, the killing of a person tends to be recorded more effectively than other crimes. Nonetheless, the challenges of cross-national comparability are considerable. National legal systems may have different thresholds for categorizing a death as intentional homicide. According to the United Nations Office on Drugs and Crime, almost half a million people (437,000) died worldwide as a result of intentional homicide in 2012. Most homicides are clustered geographically in the Americas (36%), Africa (31%) and Asia (28%), while Europe (5%) and Oceania (0.3%) had the lowest shares of homicide regionally. Homicide is also an overwhelmingly male-centric crime globally, with 95% of perpetrators male and nearly 80% of victims male.
Despite varying definitions, ‘homicide’ is perhaps the most widely collected and reported crime in law enforcement and criminal justice statistics. Due to its seriousness, the killing of a person tends to be recorded more effectively than other crimes. Nonetheless, the challenges of cross-national comparability are considerable. National legal systems may have different thresholds for categorizing a death as intentional homicide. According to the United Nations Office on Drugs and Crime, almost half a million people (437,000) died worldwide as a result of intentional homicide in 2012. Most homicides are clustered geographically in the Americas (36%), Africa (31%) and Asia (28%), while Europe (5%) and Oceania (0.3%) had the lowest shares of homicide regionally. Homicide is also an overwhelmingly male-centric crime globally, with 95% of perpetrators male and nearly 80% of victims male.
The global average homicide rate stands at 6.2 per 100,000 population, but Southern Africa and Central America rates are over four times higher than that according to the UN Office on Drugs and Crime’s 2013 Global Study on Homicide. Honduras is the most violent country, with 90.4 homicides per 100,000 population in 2012, followed by Venezuela (53.7) and Belize (44.7). The U.S. homicide rate (4.7) is actually below the global average, despite the country’s violent reputation and history of mass shootings. Despite its notorious reputation, Chicago is far from the most deadly U.S. city when adjusted for population – in fact it is 21st (18.5). According to data from the FBI, the most violent cities per 100,000 population are Flint, Michigan (62.0), Detroit (54.6), New Orleans (53.2), and Jackson, Mississippi (38.5).
Supporting Indicators
1. Crimes against property per 100,000 population.
Property crimes include many common crimes relating to theft or destruction of another’s property, and range from lower-level offenses such as shoplifting or vandalism, to higher-level felonies. The ISO 37120 standard definition counts all crimes involving the “unlawful taking or destruction of property, but without the threat or use of force against a person,” and includes burglary, larceny, motor vehicle theft and arson.
As with violent crimes, property crimes in most developed countries have fallen significantly over the past few decades, as the Economist notes, “even in the face of high unemployment and economic stagnation.” In the U.S., property crimes over the past decade have decreased over 14%, with the current rate estimated by the FBI at 2,859 property crimes per 100,000 population. While in decline, property crimes still resulted in $15.5 billion in losses in 2012. Technology has played a significant role in reducing certain types of property crime -- especially auto theft. For example, engine immobilizers introduced by automakers in the late 1990s make it virtually impossible to start a car without the ignition key, which has helped lead to a 96% drop in car thefts in New York City since 1990.
2. Response time for police department from initial call.
How quickly police respond to emergency calls for assistance is an important indicator of overall citizen safety. Unfortunately, there isn’t a standard for measuring response time, as different departments define emergencies differently. Some police departments average response times across 3% to 5% of their 911 calls, while others average across 10% or more. “It’s very, very tough to compare,” reported Nahanni Pollard, faculty and criminology coordinator at Douglas College in New Westminster, British Columbia in a Wall Street Journal blog. “They’re comparing apples to chairs. It’s really a mildly irritating and complicated system.” Officers also arrive at the scene at times and fail to notify dispatch, especially if they are involved immediately upon arrival. The ISO 37120 standard attempts to overcome this variability by measuring response time to all distress calls, though without a closed loop process to confirm on-site arrival data may continue to be incomplete.
![]() Several internet articles cite an American Police Beat report claiming a 10-minute average emergency call response time. I spoke with this organization, and while they acknowledge reprinting something about this topic in the past, they had no idea as to original source. In 2013, Detroit’s emergency manager Kevyn Orr claimed part of the reason the city needed to declare bankruptcy was because the police department was badly lagging national norms for response times. According to Orr, Detroit police took an average of 58 minutes to respond to calls. Since 2008, the International City / County Management Association Center for Public Safety Management has conducted police operational and data analyses in 61 cities and towns located in 26 states in all regions of the U.S. Their white paper shows a mean service time for a call for response from the public was 28.7 minutes, with a minimum of 16 minutes and a maximum of 42.9 minutes.
Several internet articles cite an American Police Beat report claiming a 10-minute average emergency call response time. I spoke with this organization, and while they acknowledge reprinting something about this topic in the past, they had no idea as to original source. In 2013, Detroit’s emergency manager Kevyn Orr claimed part of the reason the city needed to declare bankruptcy was because the police department was badly lagging national norms for response times. According to Orr, Detroit police took an average of 58 minutes to respond to calls. Since 2008, the International City / County Management Association Center for Public Safety Management has conducted police operational and data analyses in 61 cities and towns located in 26 states in all regions of the U.S. Their white paper shows a mean service time for a call for response from the public was 28.7 minutes, with a minimum of 16 minutes and a maximum of 42.9 minutes.
3. Violent crime rate per 100,000 population.
This indicator measures murder and non-negligent manslaughter, rape, robbery and aggravated assault. Like other crime statistics, differences in definition and reporting threshold complicate country comparisons. And like other types of crimes, the violent crime rate has been in decline for several years. European Union member states experienced a 6% decrease in violent crimes between 2007 and 2010. In the U.S., the rate was 403.6 violent crimes per 100,000 population in 2010, according to the FBI, a 13.4% reduction from 2001 levels. U.S. cities with the most violent crimes per 100,000 population include Detroit (2,123), Oakland (1,993) and St. Louis (1777); those with the fewest include Plano, Texas (131), Henderson, Nevada (169) and Virginia Beach, Virginia (169).
###
George Karayannis has over 25 years of emerging technology and complex solutions sales, business development and marketing experience and has held leadership positions at Schneider Electric, Lockheed Martin Energy Solution, AT&T and wireless sensor startups. He has also served as a city councilman and is restoring a 100-year old opera house to LEED Gold status. @gkarayannis
Next in the series: Shelter indicators for smart cities
Previously in our Dissecting ISO 37120 series:
- Why this new smart city standard is good news for cities
- Economic indicators in the new smart city standard
- Why education may be the most important smart city indicator of all
- What the new smart city standard says about energy
- Does your city's air quality measure up to the new smart city standard?
- How debt, spending and tax collections add up in new smart city standard
- Fire and emergency response indicators -- how safe is your city?
- How voting, women and corruption figure in the smart city standard
- How healthy is your city (and what zip codes have to do with it)
- How fun is YOUR city? (And yes, it really does matter)