By George Karayannis, LEED AP
![]() We continue our series on the new ISO 37120 Smart City standard with a look at the ninth of 17 themes defined in the standard -- recreation indicators. As previously described, ISO 37120 includes 46 ‘Core’ (must report) and 54 ‘Supporting’ (should report) indicators. The recreation theme has no Core indicators and just two Supporting indicators.
We continue our series on the new ISO 37120 Smart City standard with a look at the ninth of 17 themes defined in the standard -- recreation indicators. As previously described, ISO 37120 includes 46 ‘Core’ (must report) and 54 ‘Supporting’ (should report) indicators. The recreation theme has no Core indicators and just two Supporting indicators.
This theme measures a city’s indoor and outdoor recreational space, and is the only theme in the standard that does not include at least one Core indicator. I will admit that I was initially concerned about this theme’s modest importance relative to the other 16. However, after researching the topic I have changed my perspective. Recreational space is not only key to a city's livability, it is an essential element of public health and, when properly maintained, provides significant economic benefitsfor both residents and cities. Public green spaces can be especially useful in combating heat island effects in cities, reducing air and water pollution and minimizing storm water runoff issues.
Furthermore, recreational spaces improve physical and psychological health, strengthen communities and make cities and neighborhoods more attractive places to live and work. In fact, the noted 19th-century landscape architect Frederick Law Olmsted referred to trees as ‘‘the lungs of a city,’’ a metaphor that illustrates the value of green space ![]() to the urban system. Yet in many cities, one in three residents lacks access to a park or natural area, and this problem is disproportionately greater for minority and low-income citizens, creating the potential for environmental injustice. Ironically, efforts to provide low-income areas with more and better green space can result in gentrification -- driving out the very citizens the park was intended to serve, and leading to a concept of “just green enough” low-income neighborhoods.
to the urban system. Yet in many cities, one in three residents lacks access to a park or natural area, and this problem is disproportionately greater for minority and low-income citizens, creating the potential for environmental injustice. Ironically, efforts to provide low-income areas with more and better green space can result in gentrification -- driving out the very citizens the park was intended to serve, and leading to a concept of “just green enough” low-income neighborhoods.
Many of the nation’s great parks, including New York City’s Central Park and San Francisco’s Golden Gate Park, were conceived and built during the second half of the 19th century, inspired by an ‘anti-urban ideal’ during the industrial revolution. According to the Trust for Public Land, city planners of the time saw these parks as a “refuge from the crowded, polluted, stressful cities -- places where citizens could experience fresh air, sunshine and the spiritually transforming power of nature.” The erosion of city centers in favor of suburban living in the 20th century led to a continual decline in park spending nationwide, although many cities are now rediscovering the economic and social benefits of their recreational assets.
The Park at Post Office Square in Boston, for example, was a blight on the city’s financial district for years, but after renovation the modest 1.7-acre lot is now considered one of the nation’s most beautiful city parks. “It clearly, without any question, has enhanced and changed the entire neighborhood,” said Serge Denis, Managing Director of Le Meridien Hotel Boston, as detailed in The Benefit of Parks white paper from the Trust for Public Land.
The Business Case for Parks (or why a walk in the park is worth $4)
Some fascinating research by the Trust for Public Land’s Center for City Park Excellence has led to a better understanding of the economic value of city parks. In its illuminating ‘Measuring the Economic Value of a City Park System’ white paper, the trust identified seven major factors spanning direct income, direct savings and environmental savings that collectively can help cities make a compelling case for green space investment. The determination of a city park system’s economic value is an emerging science, and the following table outlines the initial model and summarizes findings from some various cities.
![]()
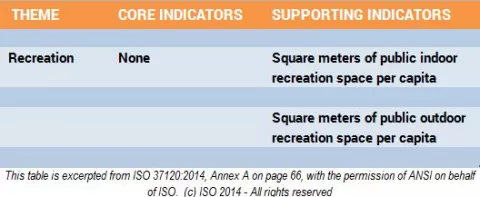
Now let's look at the recreation indicators highlighted in ISO 37120.
![]()
Supporting Indicators
1. Square meters of public indoor recreation space per capita.
This indicator encompasses land and buildings open to the public and used primarily for recreation; it includes city-owned or maintained buildings. Also included are facilities not owned or operated by the city as long as they are open to the public -- such as state or federal buildings, schools and colleges and non-profit facilities. For multi-use facilities only the play area is counted, and parking lots are excluded.
2. Square meters of public outdoor recreation space per capita.
Public space is broadly defined to mean land and open space available to the public for recreation. Also included are lands not owned or operated by the city as long as they are open to the public -- such as state or federal lands, school and college grounds and non-profit lands. Wooded areas of parks are included but parking lots are not.
Many organizations rank cities by their livability on a range of criteria. The Trust for Public Land’s recent Park Score Index is one such insightful ranking of 60 U.S. parks based on a number of factors, including park acres as a percentage of city area. The index reflects a range of city park area ranging from 2.2% in Fresno (ranked No. 60) to 33% in Honolulu (ranked No. 28, primarily due to small park size, low park spending per resident and few residential playgrounds). The median percent of park space was 9.3%, with a median park size of 5 acres.
An additional metric gaining currency with city planners is the percentage of city residents who live within a half-mile (approximately a 10-minute walk) of a park. The ubiquitous nature of computerized mapping has made this metric easy to measure. This distribution metric is a useful corollary to the pure quantitative metric of acres of parkland. The Trust for Public Land pioneered this work, showing that city results range from nearly 100% 10-minute-walkability to parks in San Francisco and Boston, to under 33% in Indianapolis and Louisville.
###
George Karayannis has over 25 years of emerging technology and complex solutions sales, business development and marketing experience and has held leadership positions at Schneider Electric, Lockheed Martin Energy Solution, AT&T and wireless sensor startups. He has also served as a city councilman and is restoring a 100-year old opera house to LEED Gold status. @gkarayannis
Next in the series: Safety indicators for smart cities
Previously in the Dissecting ISO 37120 series:
- Why this new smart city standard is good news for cities
- Economic indicators in the new smart city standard
- Why education may be the most important smart city indicator of all
- What the new smart city standard says about energy
- Does your city's air quality measure up to the new smart city standard?
- How debt, spending and tax collections add up in new smart city standard
- Fire and emergency response indicators -- how safe is your city?
- How voting, women and corruption figure in the smart city standard
- How healthy is your city (and what zip codes have to do with it)