We've all been predicting that Open Data and other smart city technologies would lead to a new era of government transparency and accountability. But let's be honest -- many cities just give lip service to the concept. Others put up Open Data, but hold back things that might make them look bad. That's why it's encouraging to see Boston's honest approach. As you will read, they publish a real-time "scorecard" that shows the good, the bad and the ugly. If you're looking to build public trust in your jurisdiction, scan the story and follow the links to get the details. — Jesse Berst
What mayor in his right mind would advertise what’s going wrong in his city? The mayor of Boston, for one. He’s doing that through an innovative open data project designed to build public trust.
But the project isn’t just an accountability tool. By using a data-driven approach, city staff can see trends — and areas that deserve much more of their attention pop into clear view.
What’s the score?
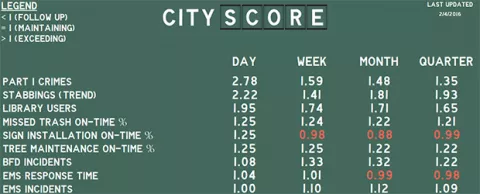
Each day the city’s open data portal refreshes its CityScore, presented on a display that mimics the baseball scoreboard at the city’s Fenway Park. And it’s all in nearly real-time.
There’s an overall citywide score each day, as well as breakdowns for a variety of key areas such as violent crimes, the speed of emergency response, the timeliness of pothole repairs, school attendance, how long it takes to complete permit reviews, and the results of constituent satisfaction surveys.
No attempt to hide poor results
There’s no opportunity for the city to spin a lackluster performance. The scores are automatically generated by SQL Server from Council Lead Partner Microsoft.
In fact, the city doesn’t even try to hide poor results. It actually draws attention to areas where it falls short. Scores that don’t meet city standards are highlighted in red.
On a recent check, the city overall met its performance goals. The overall score was 1.18 — 1.0 meets the goal and anything higher exceed it. Violent crimes are sharply lower. Timely trash pick-up is happening more often and library usage is growing by leaps and bounds.
But there were also several areas where the city fell short. Fire department and streetlight repair response times didn’t meet the goal. In fact, they haven’t all quarter.
Focusing attention on improvements
The results of constituent satisfaction surveys were especially poor — on one day they missed the goal by half. Perhaps more troubling, the results are getting steadily worse. The week before, the results were one-third short of goal. The month before, they were barely 10% short.
Mayor Marty Walsh says that’s one of the ways the data-driven approach can really help the city to do better.
“This overview of city metrics allows us to take immediate action within our departments to improve city services to make our city safer and smarter,” Walsh said in a statement.
With a data-driven approach, there’s no question about whether the city is performing to the standards it set for itself. And consistent shortcomings on a dashboard help city staff see at a glance where they need to focus their attention.
More stories …
Need a cure for what ails your city? Data is the best medicine
Improving citizens' lives with data: 'What Works Cities' selected