In recent years, our cities have experienced significant deforestation as a result of private and public development, leading to a reduction in tree numbers and vegetation cover.
This loss has had a detrimental impact on our cities; overall green infrastructure, making it more difficult to adapt to the challenges posed by climate change and further increasing the urban heat island effect. The challenges of rising temperatures put pressure on the health and well-being of our communities and stress on key infrastructure assets.
However, the future of our smart cities must consider a landscape-based digital twin in our city planning and design. Utilising near real-time data of natural indices to better manage our green infrastructure.
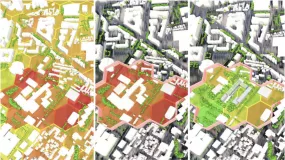
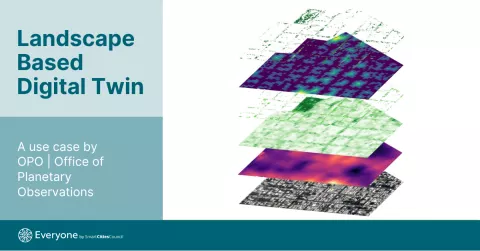
In this case study, we present a landscape-based digital twin derived from satellite remote sensing and machine learning. Office of Planetary Observations (OPO) has developed the ‘Urban Greening Pack’, consisting of five relevant layers, which includes; satellite imagery, land surface temperature, green infrastructure, tree canopy mapping, cooling gradient, and tree health. By combining these layers, we can gain a better understanding of the impacts that capital works projects have on nature across cities.
The case study completed over Melbournes CBD (Hoddles Grid), proposes the layers of data which can inform decision-makers across policy, design, construction, and maintenance. As a digital twin available in near-real time, this allows for benchmarking and ongoing monitoring over a given boundary area. To better understand and manage the built environment across numerous daily decisions throughout the world’s cities. This approach not only promotes sustainable development practices but also enhances the overall well-being of our cities by increasing access to nature, and being adaptive to climate shocks whilst also reducing the Urban Heat Island effect.
Images in Isometric (starting from bottom) 1. 50cm Maxar Imagery, 2. 30m Land
Surface Temperature, 3. 10m Green Infrastructure, 4. 50cm Tree Canopy Mapping, 5.
Cooling Gradient, 6. 50cm Tree Canopy Health